01Build a report
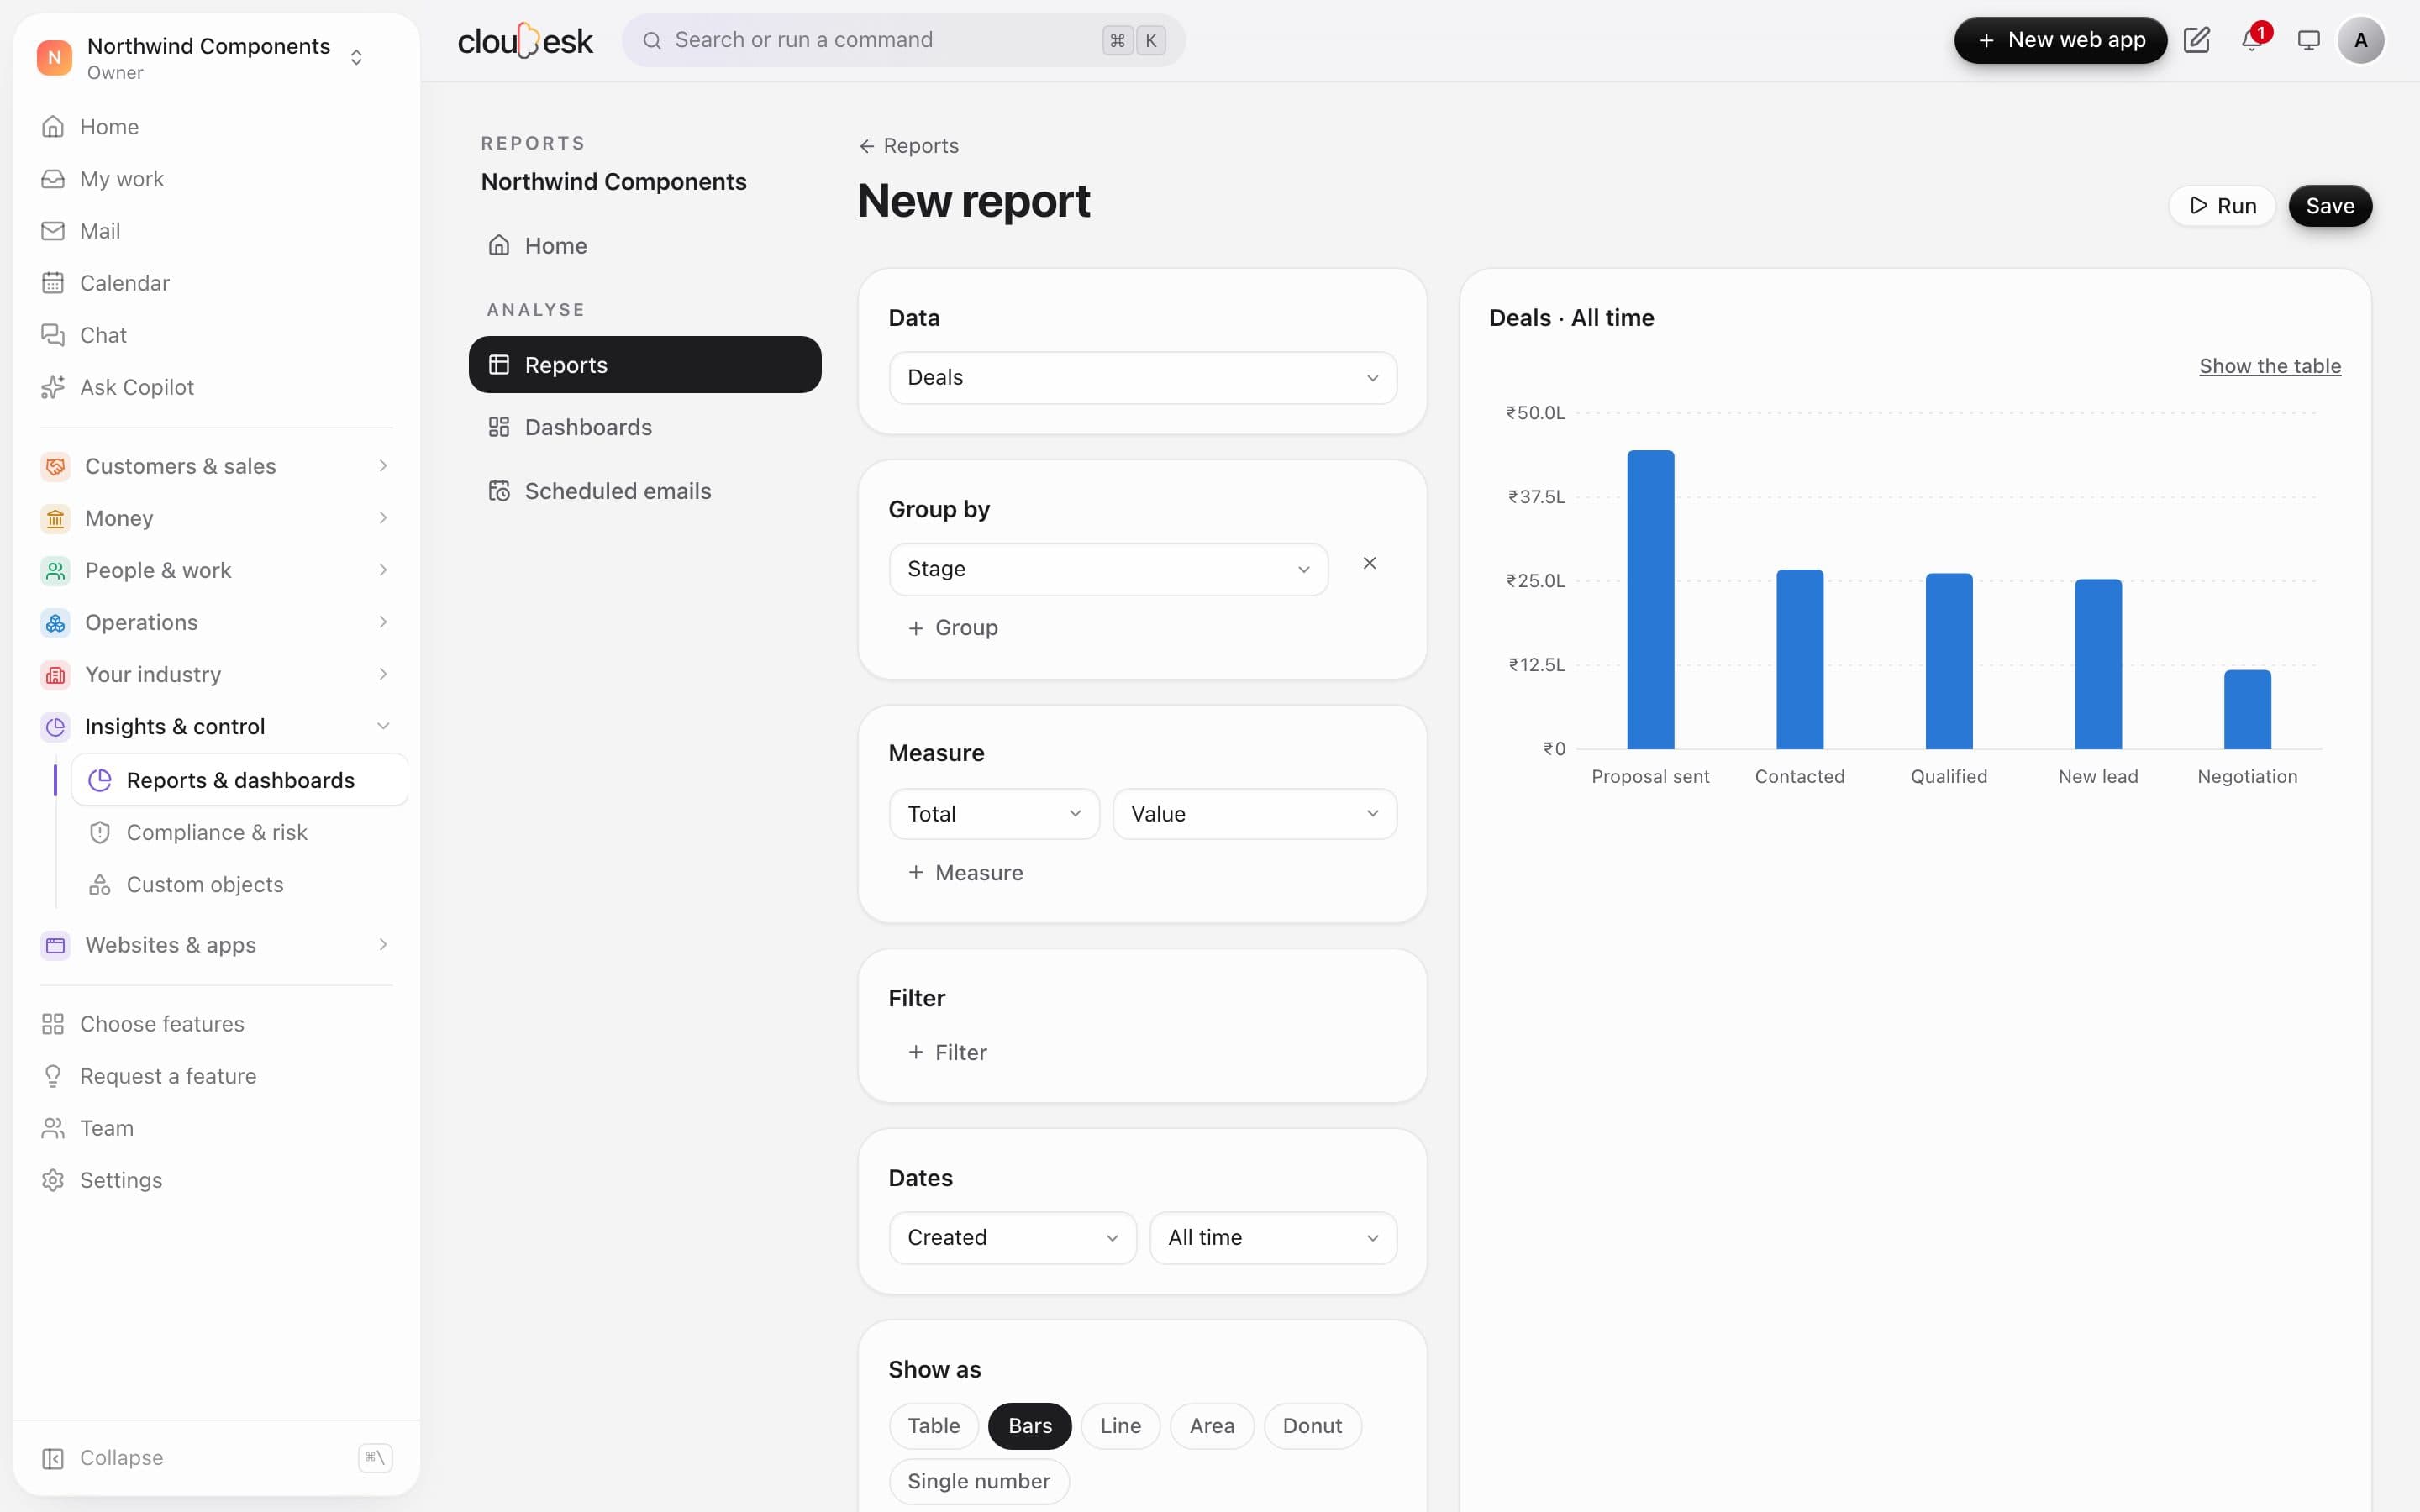
Pick the data, group it, chart it.
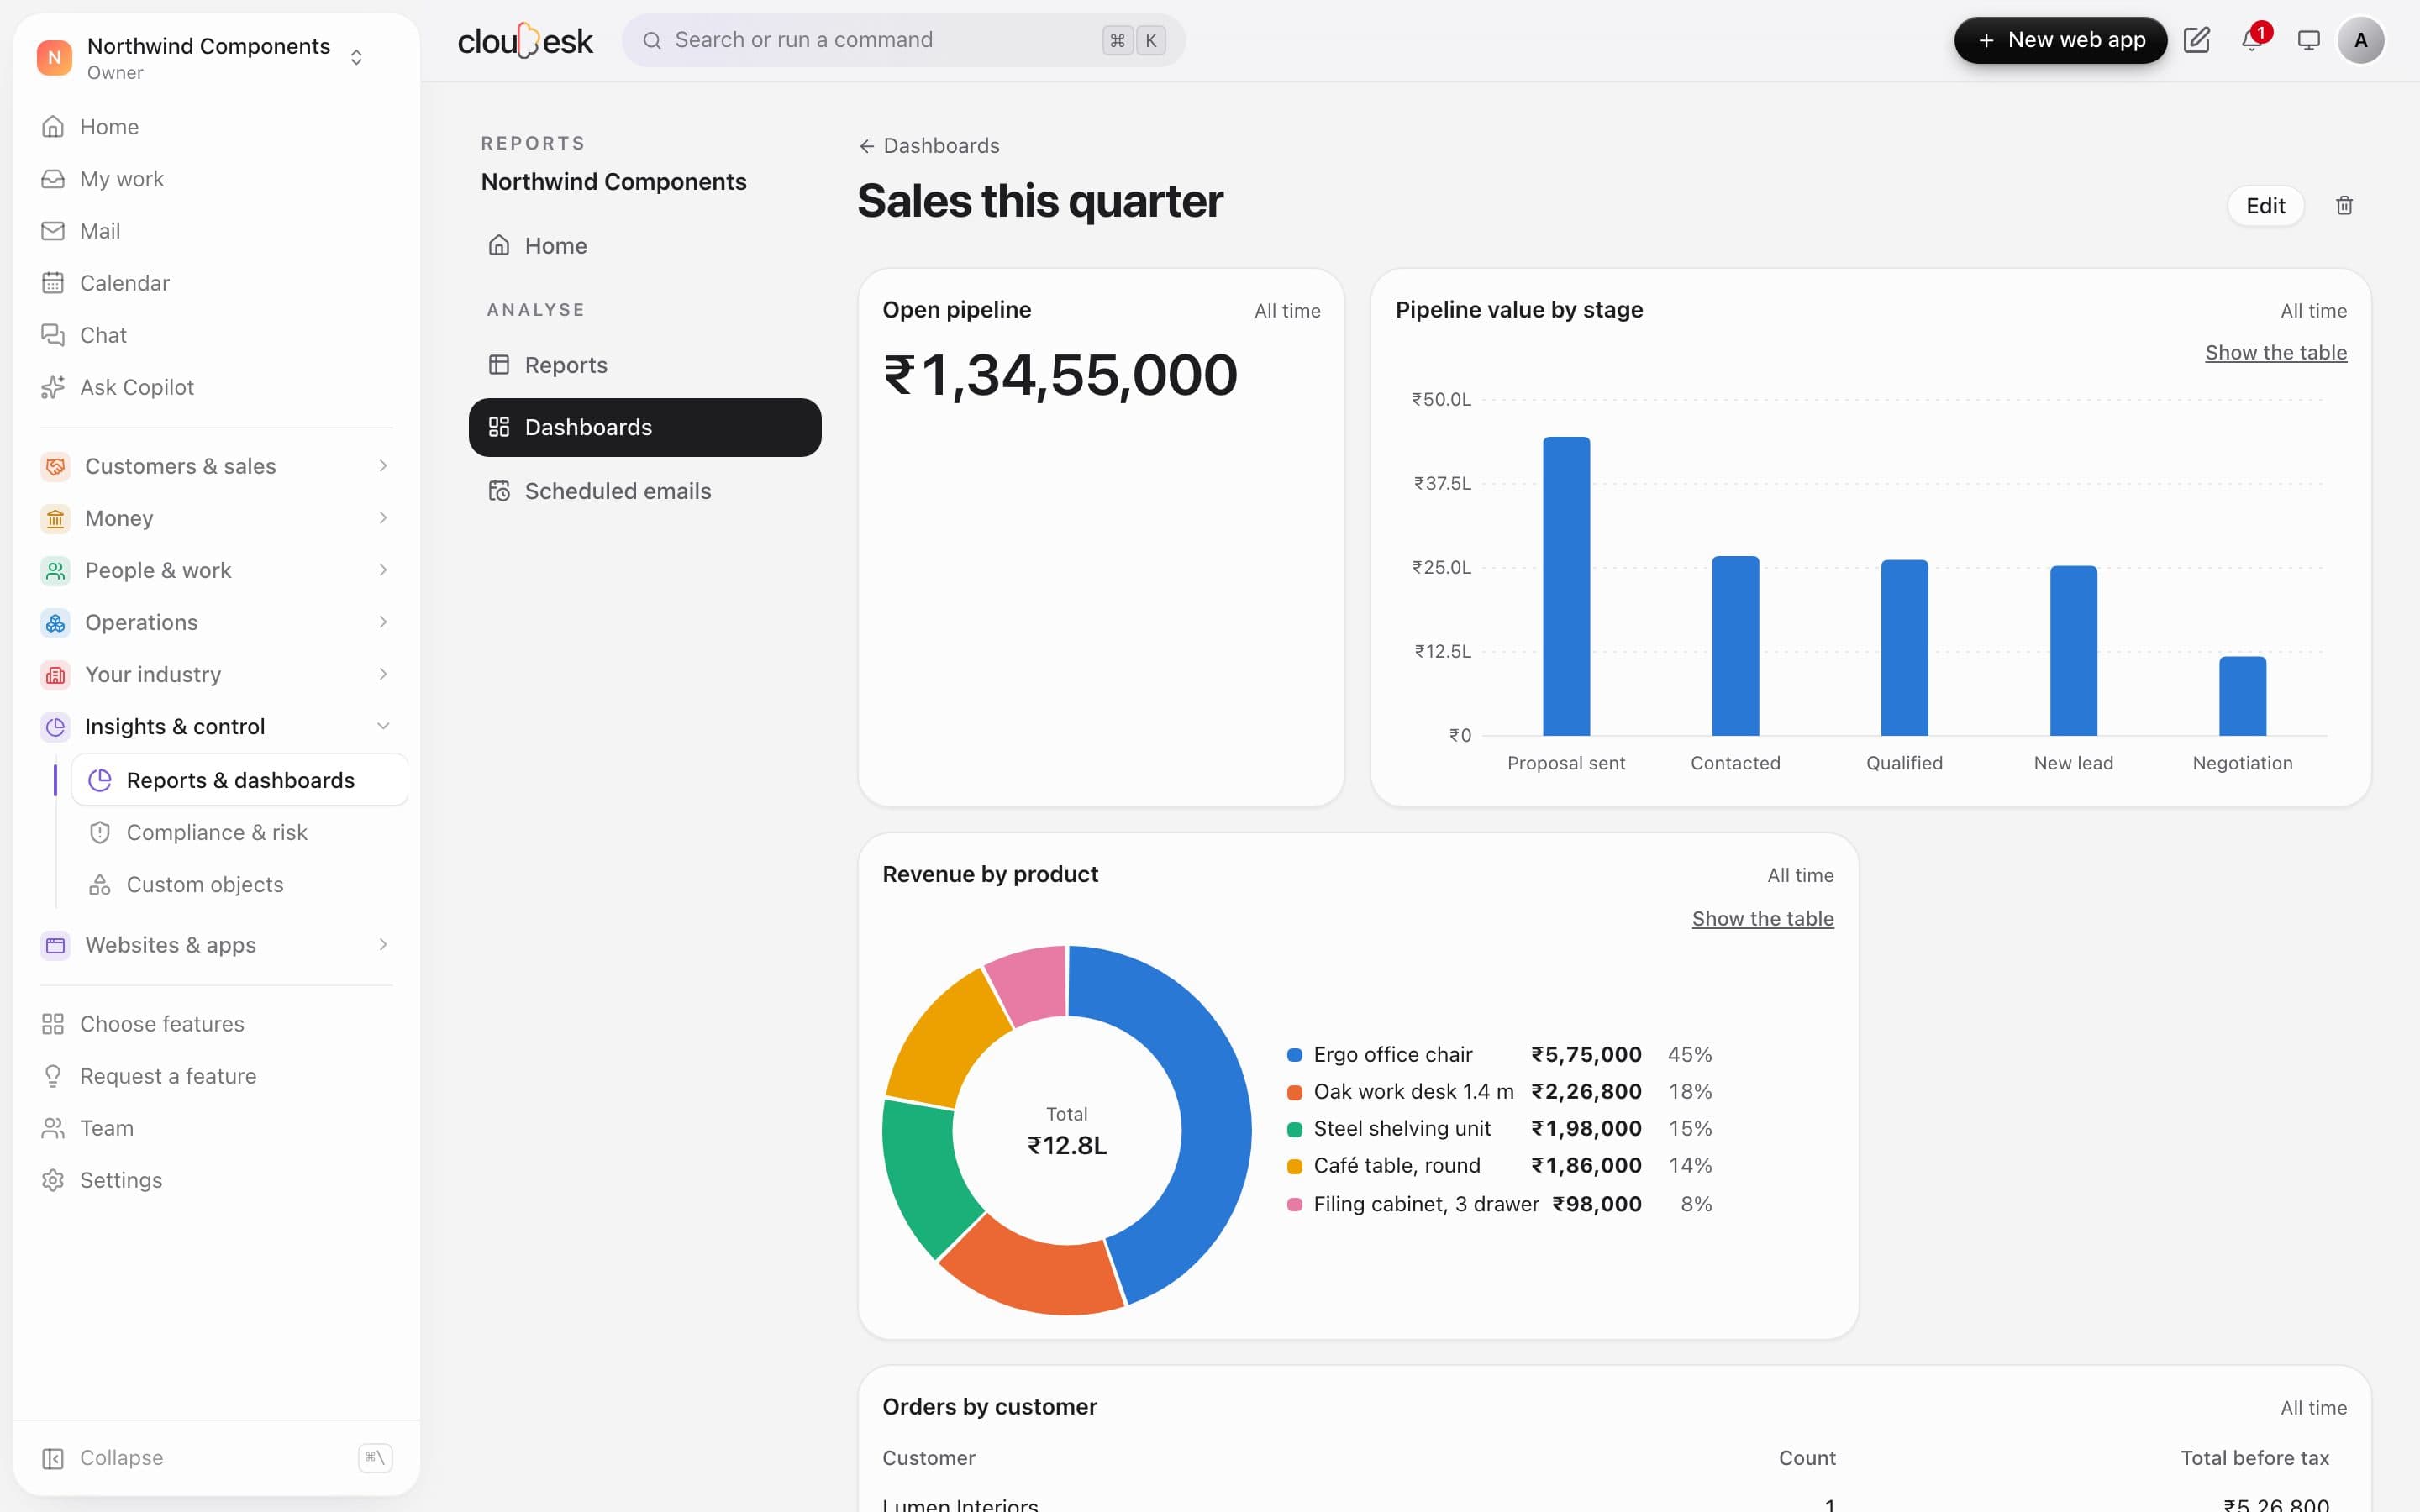
Choose a kind of data, group it by any field, and total, count or average what you need. Show it as a table, bars, a line, an area, a donut or a single number.
- Data from across your workspace
- Group by up to three fields
- Filters and date ranges